
When Multiple Systems Fail at Once
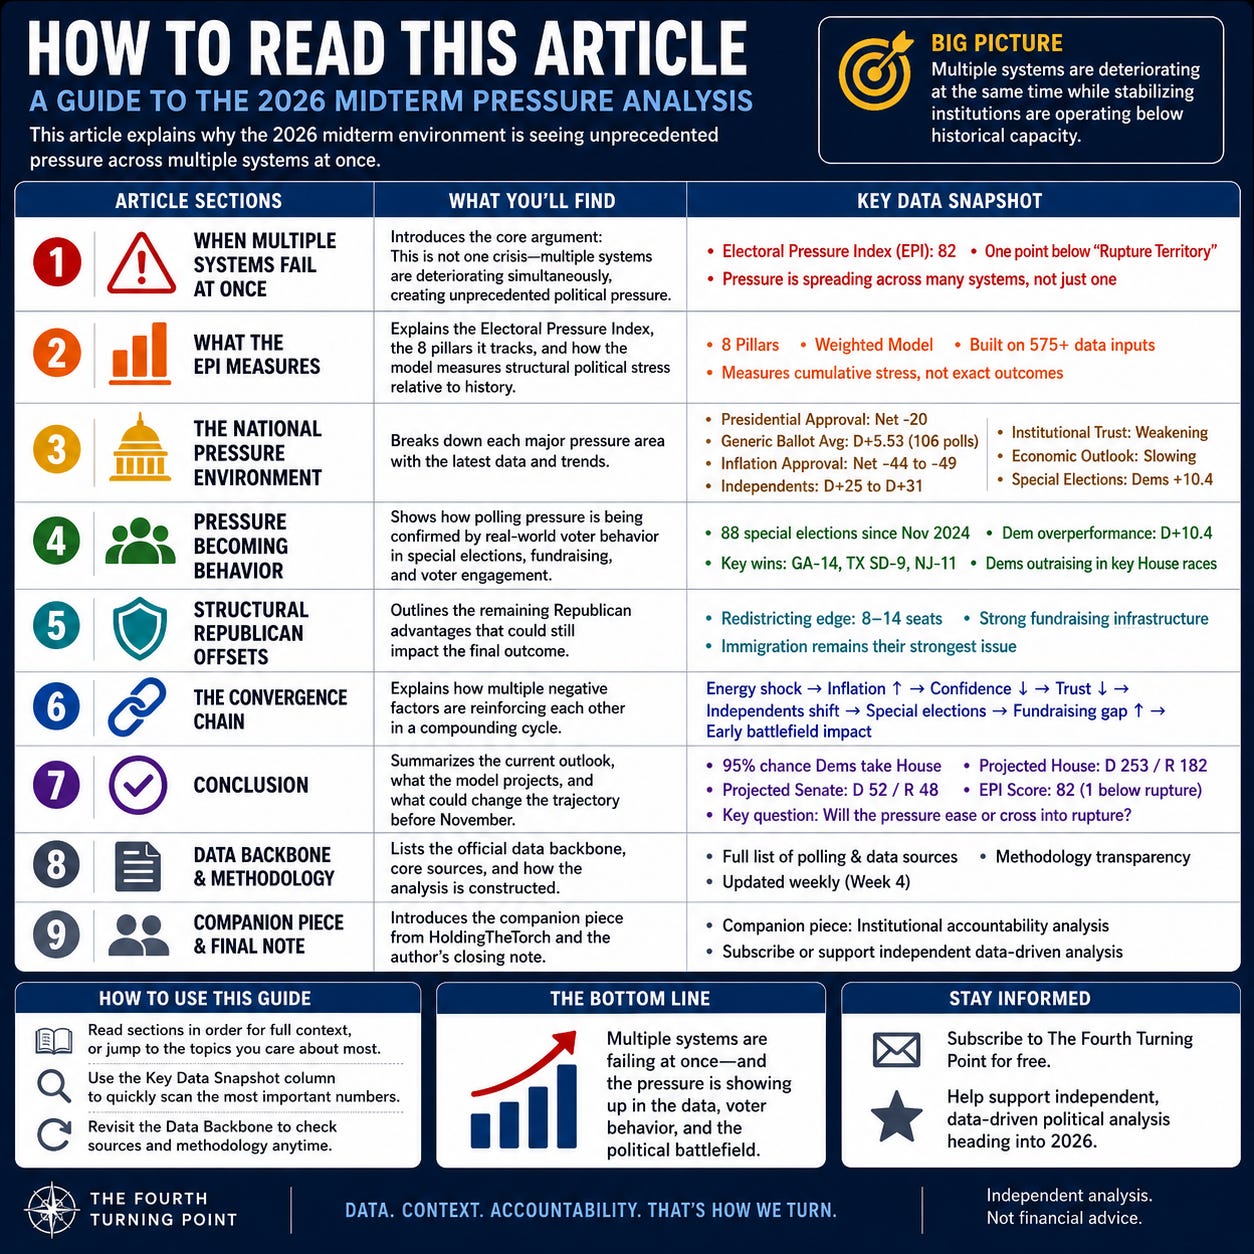
The 2026 midterm environment is no longer being driven by one crisis. Multiple systems are deteriorating at the same time.


THE FOURTH TURNING POINT
May 2026
This piece is part of a two-part crossover between The Fourth Turning Point and HoldingTheTorch.
The Fourth Turning Point maps the data and pressure architecture behind the 2026 environment. HoldingTheTorch examines the institutional accountability crisis underneath it.
Data framework by The Fourth Turning Point | Institutional analysis by HoldingTheTorch
Most wave elections break around one dominant pressure point.
1994 had healthcare and anti-government backlash.
2006 had Iraq.
2010 had the ACA and the post-crisis economy.
2018 had Trump himself.
2026 is becoming something structurally different.
The pressure is no longer concentrated in one category.
It is spreading across multiple systems simultaneously.
That is the structural argument this piece makes.
The argument is not that one thing went wrong.
The argument is that multiple systems are deteriorating at the same time while the institutions that normally absorb political damage are operating below historical capacity.
The Electoral Pressure Index now reads 82.
It has risen in every published edition of this series without reversing once. The score did not reach 82 because one indicator collapsed. It reached 82 because approval, economic trust, inflation approval, independent voter alignment, and behavioral confirmation through special elections all deteriorated together.
At 82, the index sits one point below what this framework classifies as Rupture Territory.
In this framework, Rupture Territory refers to pressure environments historically associated with severe wave-level seat loss and weakened stabilizing mechanisms across the political system.
Only a small number of modern midterm environments have entered the EPI’s projected rupture range historically associated with wave-level seat loss cycles.
The question entering summer is whether the environment stabilizes below that threshold or continues moving toward it.
What the EPI Measures
The Electoral Pressure Index was built to measure structural political stress rather than isolated polling movement.
The framework integrates eight major categories historically associated with midterm deterioration:
presidential approval,
generic ballot movement,
issue approval,
demographic coalition movement,
independent voter alignment,
economic expectations,
institutional trust,
and special-election overperformance.
Each category is normalized against historical midterm conditions from 1974 through 2022.
The result is a composite score measuring where the current environment sits relative to comparable modern midterm cycles.
Pillars and weights
Presidential Net Approval 23%
Generic Congressional Ballot 18%
Issue-Specific Approval 17%
Demographic Coalition Movement 11%
Independent Voter Margin 9%
Economic Expectations 8%
Institutional Trust 7%
Special Election Overperformance 7%
The most important variable in the model is not any single pillar.
It is the relationship between them.
In stable political environments, indicators offset one another. Economic resilience compensates for institutional distrust. Strong issue alignment absorbs weakness elsewhere. Political systems remain functional because pressure disperses rather than compounds.
The Week 4 dataset shows those offsetting mechanisms weakening substantially.
Across roughly 575 data inputs, including 106 generic ballot surveys, the major pillars are now moving in the same direction simultaneously.
The environment is not experiencing one dominant shock with stabilizing counterweights.
It is experiencing convergence.
The model is designed to measure cumulative political stress rather than predict exact electoral outcomes months in advance. Its purpose is to estimate directional exposure and structural pressure inside the national environment.
The National Pressure Environment
Presidential Approval
Presidential approval sits near net -20 across major tracking averages:
Silver Bulletin: -19
RealClearPolitics: -15.8
FiftyPlusOne: -22.8
CNN aggregate: -28
The direction is consistent across all of them.
Generic Congressional Ballot
The 106-poll generic ballot dataset shows:
Democrats leading in 103 polls
Republicans leading in 0
Three ties
Straight arithmetic average: D+5.53
Trendline by period
February: D+4 to D+5
March: D+5 to D+6
April: D+6 to D+7
Early May: D+7 to D+8
Each month has shown further Democratic expansion relative to the prior period.
Recent upper-end readings include:
AtlasIntel: D+15
RMG: D+9
Marist: D+10
Big Data Poll: D+9.8
Focaldata/FT: D+7
Cygnal: D+7
AtlasIntel and Cygnal carry structural significance because both firms have historically shown Republican-friendly house effects relative to industry averages.
When firms with Republican house effects produce results near the upper end of the distribution, the signal becomes harder to dismiss as methodology alone.
Inflation and Economic Trust
This is where the environment becomes historically unusual.
Inflation approval now sits between net -44 and net -49 across major recent surveys.
In several datasets, these readings are comparable to or worse than inflation-approval conditions seen during the Biden-era environment that helped cost Democrats the House in 2022.
Recent inflation approval:
Reuters/Ipsos: 25 approve / 71 disapprove
CNN/SSRS: 26 / 74
ABC/Ipsos: 25 / 74
Fox News: 28 / 72
YouGov/Economist: 25 / 69
Broader economic approval:
Reuters/Ipsos: 30 / 64
CNN/SSRS: 30 / 70
Marist: 35 / 61
Fox News: 34 / 66
Fox News polling now shows Democrats leading Republicans on economic trust for the first time in more than a decade.
When the pollster historically most favorable to Republican economic credibility shows the trust advantage disappearing, it signals broader movement inside the electorate.
Economic Expectations
Economic expectations deteriorated further between Week 3 and Week 4.
Growth remained positive, but economic momentum weakened relative to expectations and prior quarters.
Q1 2026 GDP growth came in below forecast at 2.0%, reinforcing a broader pattern of slowing momentum rather than outright contraction.
The concern inside the dataset is not current recession conditions alone. It is the direction of the trajectory:
slowing growth,
elevated oil prices,
continued Hormuz instability,
weakening consumer confidence,
and rising recession expectations across markets and surveys.
Forward-looking indicators remain broadly negative:
Gallup future quality-of-life expectations at a 20-year low
Elevated recession probability pricing across prediction markets
Continued energy market disruption tied to Hormuz instability and the Iran conflict
Most voters do not expect conditions to improve before November.
Midterms punish trajectory as much as current conditions.
Independent Voters
Independent voters remain the most structurally dangerous variable in the dataset.
Recent readings:
Quinnipiac: D+31 among independents
Navigator: D+22
Harvard/Harris: D+28
CNBC/Hart polling showed:
81% of independents disapproving of Trump’s economic handling
87% disapproving of inflation handling
The movement since February falls within the historical range observed in 1994 and 2010, two of the largest House-loss cycles in the modern era.
Institutional Trust
Institutional trust has weakened across multiple measurements for four consecutive months.
The Strength in Numbers / Verasight April survey found roughly two-thirds of Americans believe checks and balances are not functioning properly under the current administration.
YouGov polling from May 2026 showed substantial public fragmentation around a major national event:
45% believed the WHCA shooting was real
24% believed it was staged
32% were unsure
The significance is not the specific conspiracy itself.
The significance is that large portions of the electorate no longer share a common baseline of institutional trust around major public events.
That erosion weakens the mechanisms that normally stabilize public confidence during periods of political stress.
Among independents specifically, polling showed a clear majority expressing little or no confidence in ICE operating within professional institutional norms.
Kalshi prediction markets also showed elevated pricing for major institutional conflict scenarios during April and May 2026.
Markets are not polls.
But they do represent expectation systems.
Multiple expectation systems are now registering elevated political instability simultaneously.
Pressure Becoming Behavior
The EPI’s most important validation mechanism is not polling.
It is observed electoral behavior.
Across 88 special elections since November 2024, Democrats have consistently outperformed baseline expectations.
Median Democratic overperformance relative to the 2024 presidential baseline now sits at D+10.4, according to MultiState Elections data.
That places the current cycle broadly in line with the full-cycle 2017 to 2018 overperformance environment that preceded the Democratic House wave.
Selected results include:
Georgia-14 special: roughly D+25 overperformance relative to the 2024 presidential baseline in an R+40 district.
Texas SD-9: Democratic flip in a Trump+17 seat
New Jersey-11: Democratic overperformance in a suburban hold
The overperformance is appearing across rural districts, Republican territory, and states Trump carried comfortably.
The pressure is national rather than isolated.
Nebraska as a Stress Signal
Nebraska may be the clearest recent example.
Tavern Research polling from May 8 to May 11 showed:
Dan Osborn: 47
Pete Ricketts: 42
The same poll showed Trump underwater in Nebraska despite carrying the state by roughly 20 points previously.
Trump running underwater in Nebraska suggests deterioration extending beyond the traditional battleground map.
Osborn’s fundraising also reached near cash parity with Ricketts.
A competitive independent challenger reaching financial parity with a Republican incumbent in a Trump+20 state reflects the same donor and enthusiasm imbalance now appearing across the broader Senate and House map.
Fundraising as Behavioral Confirmation
Fundraising behavior now reinforces the same directional trend.
Democratic candidates have outraised Republican opponents in a majority of top-tier competitive House districts during the latest filing period.
Examples:
James Talarico raised more than $40 million total for his Texas Senate campaign, including a record $27 million during Q1 2026 alone
Roughly 98% of Talarico’s donations were $100 or less, generated from more than 540,000 individual contributions
Sherrod Brown's campaign (Ohio Senate) reported more than $16.5 million in cash on hand, dramatically outpacing Husted's $2.9 million raised and $8.2 million in reserves
Roy Cooper Raises More Than $13.8 Million During First Quarter of 2026
Small-dollar fundraising reflects behavior rather than sentiment alone.
Voters donating early have already formed political judgments about the governing environment.
The same directional trend is now appearing across polling, elections, donor behavior, and campaign infrastructure simultaneously.
Structural Republican Offsets
The environment is highly unfavorable for Republicans under current conditions.
It is not irreversible.
Map Efficiency
Republicans retain meaningful structural advantages through district geography and recent court decisions involving redistricting.
The combined effect of:
Louisiana v. Callais
Alabama VRA rulings
Virginia redistricting outcomes
likely provides Republicans an estimated structural edge in the range of 8 to 14 House seats depending on implementation.
The practical consequence is straightforward:
Democrats likely need roughly D+4 nationally to secure a House majority under the current map structure.
The current D+5.53 average clears that threshold.
The lower end of the polling range does not.
Republican Institutional Fundraising
Republican institutional infrastructure remains powerful.
The NRCC and affiliated groups continue posting strong fundraising numbers, while the RNC maintains a substantial cash-on-hand advantage over the DNC.
That infrastructure still matters late in the cycle.
Immigration
Immigration remains the administration’s strongest surviving issue domain.
Several surveys continue showing Republicans competitive or slightly positive on immigration handling even while other issue areas deteriorate.
That stabilizes the Republican base coalition.
But at current pressure levels, it has not reversed broader economic dissatisfaction or independent voter movement.
The Convergence Chain
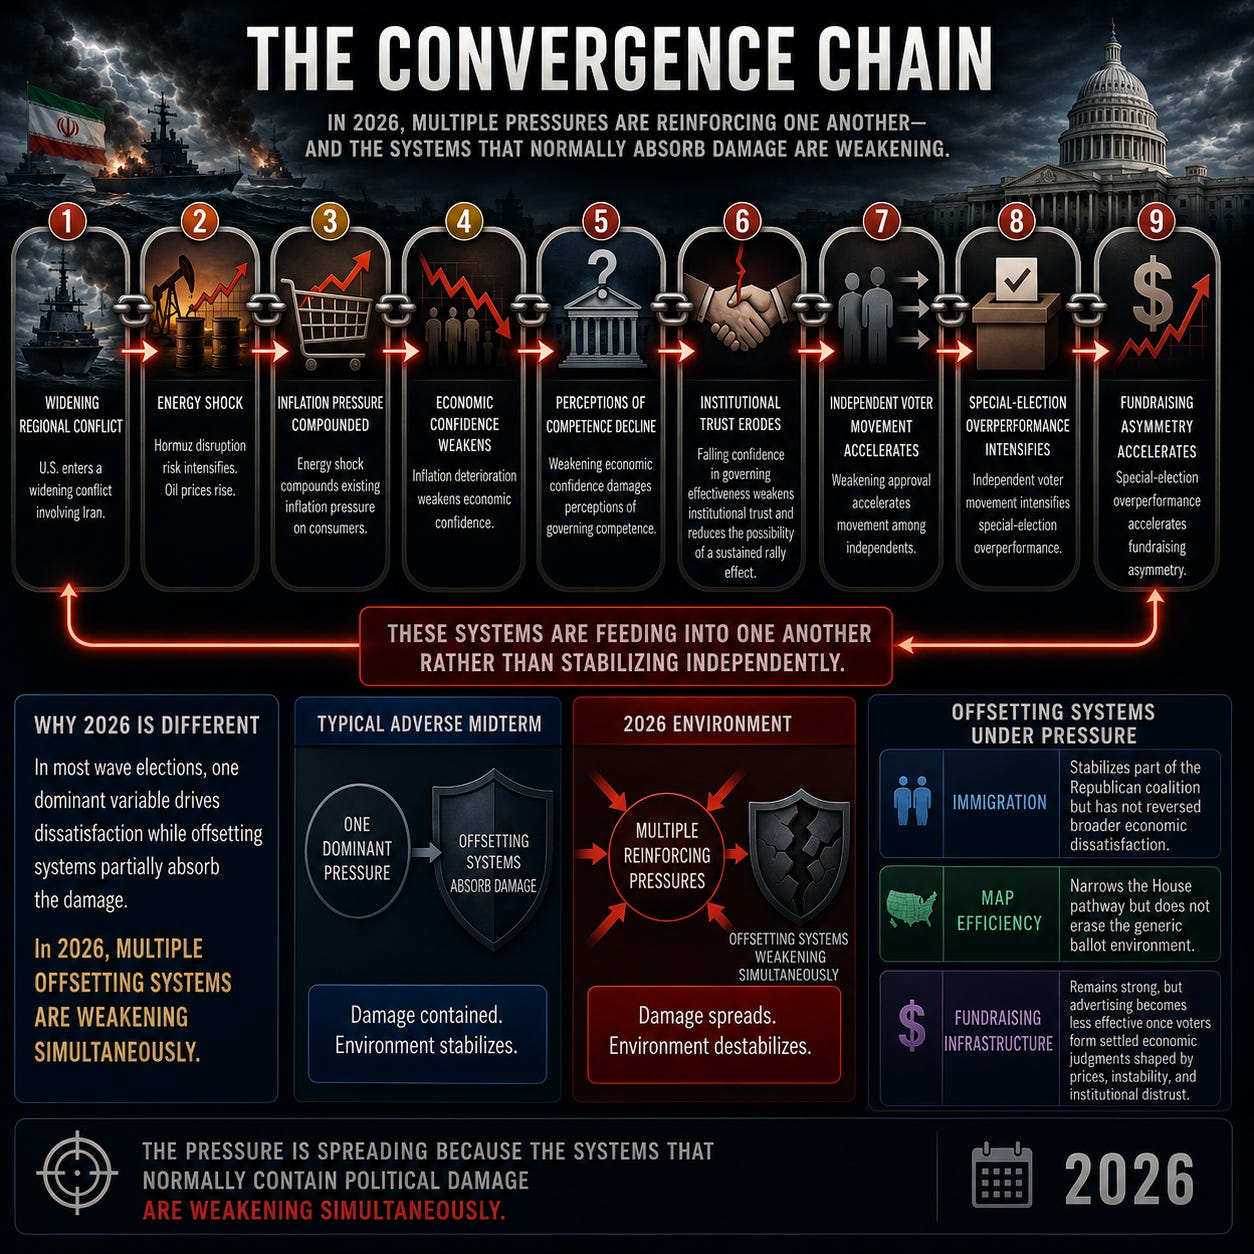
The most important development in the Week 4 dataset is that the major pressures are no longer operating independently.
They are reinforcing one another.
The administration entered a widening regional conflict involving Iran while energy markets were already fragile.
Oil prices rose as Hormuz disruption risk intensified.
The resulting energy shock compounded existing inflation pressure already weighing on consumers.
Inflation deterioration weakened economic confidence.
Weakening economic confidence damaged perceptions of governing competence.
Falling confidence in governing effectiveness weakened institutional trust and reduced the possibility of a sustained rally effect.
Weakening approval accelerated independent voter movement.
Independent voter movement intensified special-election overperformance.
Special-election overperformance accelerated fundraising asymmetry.
Fundraising asymmetry is now shaping the battlefield months before Election Day.
These systems are feeding into one another rather than stabilizing independently.
That is what separates 2026 from a standard adverse midterm environment.
In most wave elections, one dominant variable drives dissatisfaction while offsetting systems partially absorb the damage.
In 2026, multiple offsetting systems appear weakened simultaneously.
Immigration stabilizes part of the Republican coalition but has not reversed broader economic dissatisfaction.
Map efficiency narrows the House pathway but does not erase the generic ballot environment.
Fundraising infrastructure remains strong, but advertising becomes less effective once voters form settled economic judgments shaped by prices, instability, and institutional distrust.
The pressure is spreading because the systems that normally contain political damage are weakening simultaneously.
Conclusion
The Electoral Pressure Index enters the summer at 82.
Current model outputs:
95% probability of Democratic House control
Mean projected Republican House loss: 48 seats
Projected House balance: Democrats 253 / Republicans 182
Projected Senate balance: Democrats 52 / Republicans 48
Generic ballot average: D+5.53 across 106 polls
The mechanisms underneath those numbers remain consistent:
presidential approval near net -20,
historically severe inflation disapproval,
independent voters running D+25 to D+31,
slowing economic momentum,
elevated recession expectations,
and special-election overperformance running near D+10.
Every major component of the model deteriorated between Week 1 and Week 4.
None reversed.
The index has not yet entered Rupture Territory.
It remains one point below that threshold.
Whether it crosses that threshold depends on whether any of the reinforcing chains described above begin to unwind:
falling energy prices,
improving economic expectations,
sustained approval recovery,
or stabilization among independents.
At present, those reversals are not visible in the available data.
What is visible is convergence.
Multiple systems are deteriorating simultaneously, with each deterioration making the next one harder to contain, while the systems that normally absorb political damage operate below historical capacity.
The central danger is no longer a single failing institution.
The danger is multiple weakening systems reinforcing one another faster than public confidence can recover.
The data shows the pressure architecture.
The companion piece from HoldingTheTorch examines what that pressure means institutionally: whether voters still believe American systems can correct failure, or whether they increasingly view those systems as absorbing failure while the public pays the cost.
Read the companion piece:
HoldingTheTorch

EPI Week 4 Official Data Backbone
EPI Score: 82 / 100
Projected Republican House seat loss: −48
House flip probability: 95%
House projection: Democrats 253 / Republicans 182
Senate projection: Democrats 52 / Republicans 48
106-poll generic ballot arithmetic average: D+5.53
Democrats leading in 103 of 106 polls
Special election median overperformance: D+10.4
Estimated Republican redistricting edge: 8 to 14 seats
Estimated Democratic popular vote threshold for House majority: D+4
Core Data Sources and Methodology Inputs
Strength in Numbers / Verasight, April 10 to April 14, 2026 institutional trust
YouGov, May 4, 2026 WHCA polling
Reuters/Ipsos, May 8 to May 11, 2026 approval and generic ballot
AP-NORC, April 16 to April 20, 2026 approval and inflation polling
Fox News / Beacon Research, April 17 to April 20, 2026 economy and generic ballot
Quinnipiac University, April 9 to April 13, 2026 independent voter polling
Tavern Research, May 8 to May 11, 2026 Nebraska Senate polling
AtlasIntel, May 4 to May 7, 2026 national generic ballot
Cygnal, May 5 to May 6, 2026 national generic ballot
MultiState Elections special election overperformance dataset
Silver Bulletin approval aggregate, May 2026
RealClearPolitics approval aggregate, May 2026
The Fourth Turning Point, Electoral Pressure Index Week 4 dataset and methodology
The Fourth Turning Point publishes independent political analysis. The author holds disclosed prediction market positions referenced in prior EPI publications. This report reflects analytical interpretation and does not constitute financial or investment advice.
If you believe the country is entering a period of rising institutional, economic, and political stress, subscribe to The Fourth Turning Point for free.
If you want to help build one of the most data-driven independent political analysis platforms heading into 2026 and beyond, consider pledging a future paid subscription.
E.J.M.
The Fourth Turning Point
 | A guest post by
|
Now please explain why this matters when there is so much proof that elections are rigged electronically?